


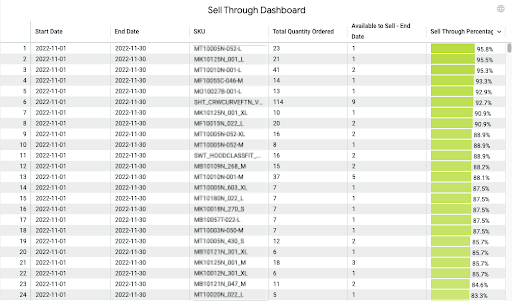
Sell-Through Rate Report: Identify popular (and unpopular) products.
A sell-through rate (STR) percentage is the amount of inventory sold within a time period relative to the amount of inventory received from your manufacturer(s), which can be analyzed for the following benefits:
- Mitigate storage costs
- Optimize supply lines
- Manage your cash flow
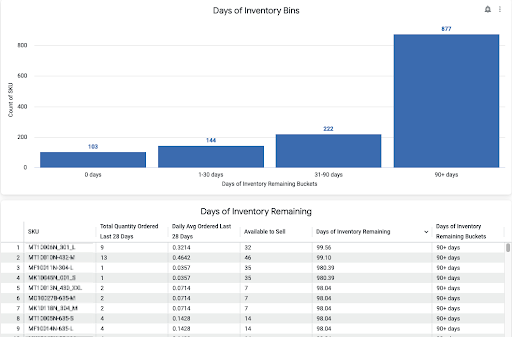
Days of Inventory Remaining Report: Improve planning & replenishment.
Get an overall sense of how long your inventory is estimated to last, based on your average sales rates for each variant and the amount of inventory you have left.
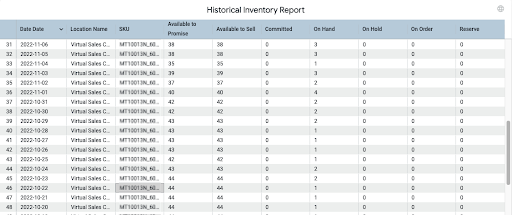
Historical Inventory Report: Analyze how inventory moves over time.
See all of the inventory statuses every day—per SKU, per location.
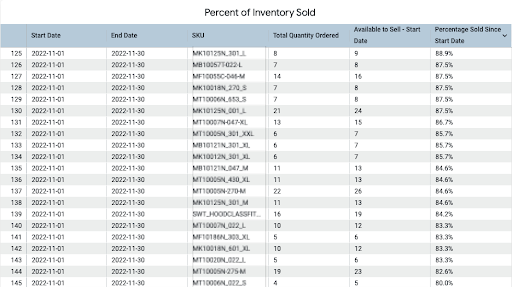
Percent of Inventory Sold Report: Assess how healthy your inventory positions are.
Monitor the performance of inventory sold during a selected period of time.
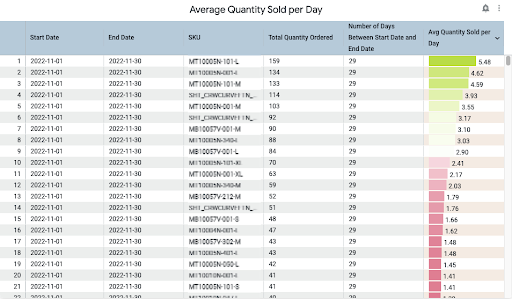
Average Quantity Sold Per Day Report: Separate consistent performers from the rest.
When you can easily compare average sales counts across SKUS, you can discern how well certain sales events are performing and know which SKUs are consistently performing well.


